Math Vs. Gerrymand
Math Vs. Gerrymandering
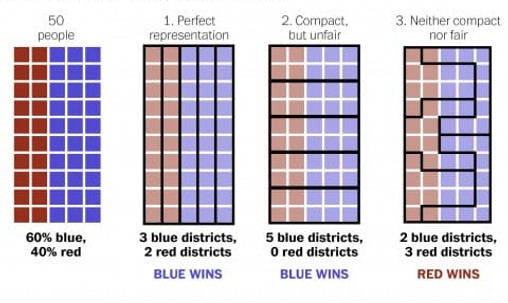
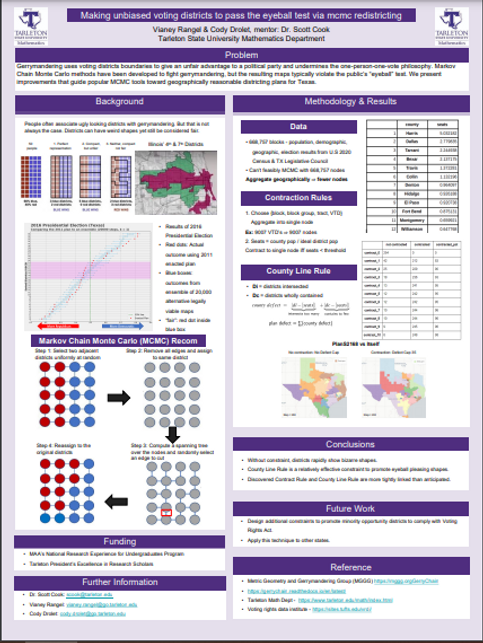
Gerrymandering is the attempt to gain an unfair political advantage by manipulating the boundaries of electoral districts. It is a significant threat to our democratic system and has proven to be a difficult issue for our legislatures and courts. The release of the 2020 Census results triggered the once-per-decade process of redrawing boundaries of election districts. This highly-charged political process profoundly affects elections for the following decade and invariably brings accusations of gerrymandering where a party gains a disproportionate political advantage by manipulating district boundaries. But how can gerrymandering be measured and quantified? In the last 10 years, mathematicians have persuasively argued in court, popular media, and academic journals that the best way to quantify gerrymandering in a districting plan is to do a statistical comparison against a large ensemble of alternative districting plans. However, generating such an ensemble is a difficult task.
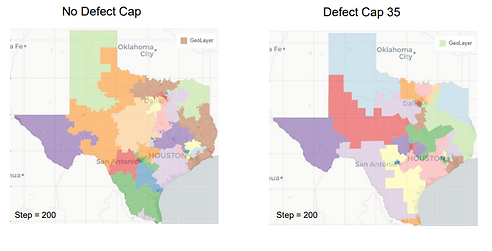
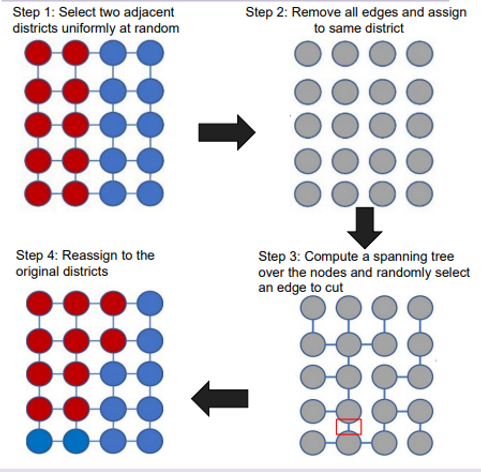
To solve this problem, mathematicians have developed powerful Markov Chain Monte Carlo (MCMC) based algorithms. However, without guidance, the MCMC-generated plans typically fail the “eye-ball” test; they have highly irregular boundaries that wantonly ignore political borders like county lines. The general bias is that if a district has a weird shape it is considered gerrymandered but that is not always the case. Most recently we present techniques that encourage recombination MCMC to respect these borders and pass the “eye-ball” test while still providing unbiased ensembles of legally-viable districting plans that provide context for evaluating the fairness of a proposed districting plan.
For more information contact Dr. Scott Cook.
Ensemble Analysis & Gerrychain
.png)
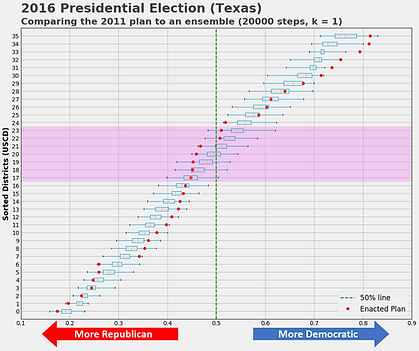
This is called an ensemble. Here's a result showing the “expected” outcome of the 2016 Pres election using an ensemble of 20000 districting plans vs the "actual" outcome. Where the red dots are outside of the blue boxes, we see evidence of “cracking & packing” - the most common form of gerrymandering.
Gerrychain - Python library enabling users without
advanced coding and hardware to use MCMC.
pypi.org/project/gerrychain
• Metric Geometry & Gerrymandering Group - Tufts, MIT,
& Harvard - summers 2018 & 19 sites.tufts.edu/vrdi
• Used in dozens of states during 2021 redistricting
PlanS2168 Vs. Itself
_PNG.png)
Student Presentations
Texas Undergraduate Mathematics Conference 10/30/21
Via Zoom Cody Drolet & Vianey Rangel
-
Making Unbiased Maps to pass the eyeball test via MCMC redistricting
Society For Industrial and Applied Mathematics 11/5/21
South Padre, TX Dr. Scott Cook
-
Fill in project title
Presidents Excellence and Research Scholars 2/9/22
Stephenville, TX Tarleton State University Dr. Scott Cook
Cody Drolet & Vianey Rangel poster presentation
-
Project Title
Texas Academy of Science 2/25/22
Houston, Tx University of Houston Clearlake Cody Drolet
Vianey Rangel poster presentation(Second place)
-
Making Unbiased Maps to pass the eyeball test via MCMC redistricting(Amir Moez prize)
Research Rodeo 4/23/22
Stephenville, TX Tarleton State University Cody Drolet & Vianey Rangel
-
Making Unbiased Maps to pass the eyeball test via MCMC redistricting
Math Day 5/4/22
Stephenville, TX Tarleton State University Cody Drolet & Vianey Rangel
-
Making Unbiased Maps to pass the eyeball test via MCMC redistricting
Vianey Rangel & Cody Drolet Texas A&M Pathways 3/4/22

Vianey Rangel & Cody Drolet SIAM 11/5/21 & TAS 2/25/22